Friday 29 July 2016

-- How Data Visualization Enhances the Analyzing Capabilities & Create Convenience--


Data visualization turns a boring report into aesthetically pleasing visuals, thereby making it easy to recognize patterns and find the exceptions.

We understand and retain information better when we can visualize our data. With our decreasing attention span (8 minutes), and because we are every now and then exposed to new or several information, it is important that we present a report in a quick and visual way. 

Patterns or insights may go unnoticed in a data spreadsheet. But if we put the same information on a pie chart, the insights become clear. 

It consolidates data into one collective, illustrative graphic. Initially, data visualization has been used for quantitative work but ways to represent qualitative work have shown to be equally as effective.

Let's take a look at how Indiastat represented the whole Jammu & Kashmir Election in a beautiful visual presentation.


Now if the visualization above was presented in it's original format with tables and spreadsheets then it might have taken us more than a hundred pages to present the same information. 

This is the beauty of of data visualization although there is a lot of hard work involved in creating such visually magnificent visualizations. There is a designing team, analytics team, GIS team and a research team involved in creating such a presentation.

As we say "Rome was not built in a day", it took us several weeks to compile all the data we had in spread sheets and was followed by planning, designing, multiple reviews, rejections and experiments.

Use of Thematic Maps in Data Visualization

"A thematic map is a type of map especially designed to show a particular theme connected with a specific geographic area. These maps can portray physical, social, political, cultural, economic, sociological, agricultural, or any other aspects of a city, state, region, nation, or continent".


We have published several books using thematic maps which is a visual boon to the readers.
Visit us and get the most relevant and highly researched data reports based on socio- economic factors.

Monday 18 July 2016

Assembly Factbooks By Datanet India

Assembly Factbooks

Assembly constituency level publication comprises the demographic and electoral features along with the historical election results at assembly level since independence and polling station level results for elections after delimitation 2008. It also covers the last held election results of rural and urban local bodies. The profiling of constituency in access of different socio-economic amenities is a unique feature of these publications.


Factoids:

-         A reference book on key electoral data of an assembly constituency with unique features of socio-religious and amenities access information
-          Provides the historical summary of the election results of a particular assembly since independence at constituency level
-          Covers the polling station level results of assembly and parliamentary elections held after Delimitation 2008
-          Results of last local bodies election falling under a particular assembly are also covered
-          Profiling of constituency with access to different socio-economic amenities is a unique feature of this publication.
-          Useful reference publications for election strategists, political parties’ leadership, contesting candidates, media persons, community/pressure groups, party office bearers, psephologists, political scientists and scholars from other disciplines. 


       Contents

Introduction
Location and Political Maps
Demographic
Electoral Features
Historical Summary Election Results
Polling Station Level Election Results
Panchayat and Local Bodies Election results
Share of Assembly Constituency
Socio- Economic Amenities
Abbreviation and sources


Tuesday 5 July 2016

Datanet India- Books & Ebooks on Pre Election Analysis in India

Books On Pre Election Analysis (Details)

Datanet has been serving the research fraternity since more than 15 years and has published several books and ebooks on socio economic research.

Pre Election Analysis is one such segment of Datanet which renders the analysis of state assembly constituencies election results in India through various thematic maps and detailed graphical representations. It consists of nine chapters viz; basic features, demographic profiles, electoral features, analysis of the results, vote differences & swings, state level time series comparison, top ten ranking of assembly constituencies and candidates and the supporting datasheets.

It also facilitates the readers to understand the performance of the candidates and the parties in a particular area and helps them analyze the current scenario.


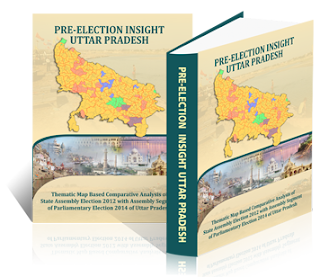
Cover Image of the Pre Election Insight Uttar Pradesh Book.datanetindia-ebooks.com/Pre- Election Insight Uttar Pradesh

This book reports the comparative analysis of Uttar Pradesh state assembly constituencies election results in the year 2012 and 2014 respectively through various thematic maps and detailed graphical representations.

It will facilitate the readers to understand the performance of the parties and candidates within a period of last two assembly elections.


To view the sample click here.


Sunday 22 May 2016

Accurate & Best Socio- economic data in India

Datanet India is perhaps the unexampled company providing Secondary level socio-economic and political statistical information about India, its states, regions, districts and electioneering to the global research fraternity since last 15 years.

Datanet India was established as an IT-enabled private limited company in February 2000 to render its services in the socio-economic information domain.

As its core activity, Datanet collects, collates and compiles in ready to use socio-economic statistical data about India, its various sectors, regions, states and districts to make it available online.


Indiastat.com is one of the prime website of Datanet India and was launched as a singleton website on 14th November 2000, at New Delhi.

Today, Indiastat.com is a cluster of 56 associate sites and perhaps the most comprehensive e-resource for accessing the secondary level socio economic statistical information about India, its 6 geographical regions, 31 states and 19 sectors on various socio-economic parameters. These parameters are: Administrative Units, Demographics, Economy, Agriculture, Civil Supplies and Consumer Affairs, Environment and Forest, Industries, Infrastructure, Companies, Education, Health, Housing, Labour& Workforce, Polity, Media, Insurance, Tourism, Crime & Law, Social Welfare & Developmental Schemes etc.
http://www.datanetindia.com